")
")
Technological collaborations in the field of nanotechnologies
 |
|  |
| 
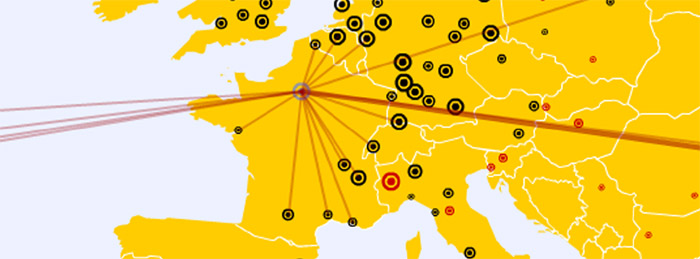
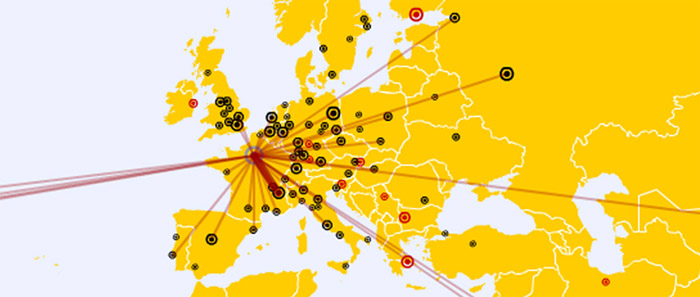
This article displays an interactive map of technological collaborations between geographical clusters where patents were registered in the field of nanotechnologies between 1990 and 2007. We have drawn a map of the networks created concerning the inventors and their localizations.
General context: elements of methodology
Based on a delineation based upon keywords, we have identified those referring to the field of nanotechnologies in the Worldwide Patent Statistical Database PATSTAT. We have collected a series of patents registered between 1990 and 2007 and tagged each one of them with a panel of information related to the patentee(s) and the inventors. Among this information, the addresses were used as indicators of geographical localization. The 650 000 patents we have identified represent approx. 1.8 million addresses. On completion, all of these addresses have been geolocalized. From the geographical areas identified in the scientific publications that represent approx. 80% of the production of knowledge (geographical clusters), we have designated those areas with other information available with the patent (patentee’s name and type, collaborations, technological specialization of the areas…).
The patents we have used to draw this map are priority applications and represent 250 000 of the patents identified in the first place. Indeed, these are close from the origin of the inventor (within time and space frame). This technique avoids collecting redundant information involved by the use of patents from the patent families..
The applicant does not necessarily come from the area where he has set up his invention (the applicant often gives the address of the company’s headquarters) but they indicate their country and town. Therefore, the inventor’s address is very useful to draw the collaborations generated by a patent considering that, for example, an application from three inventors from three different countries indicates a collaboration between those three countries.
There are great differences in the system of patenting between the US, Asia and Europe. For example, in the field of nanotechnologies, the average amount of applications in the US represents a much larger proportion of inventors per application than in Europe. As a result, we use a fractional number to apply a value to each address of patent: for a patent involving 5 inventors, each inventor is equivalent to 1/5 of the patent.
Full screen mode - map of technological collaborations in the field of nanotechnologies
Precisions concerning the depicted technological collaboration networks:
Once the priority applications (patents) were located on the globe, we identified the agents working in the field in those areas (clusters): institutions, companies and firms, governmental laboratories and hospitals.
2 different dots are used on the map:
- Black dots: clusters that are integrated connections in the global networks of nanotechnology development.
- Red dots: clusters that are not integrated into those networks but have a significant technological production in the field of nanotechnology.
The different indicators displayed on the map:
Different kinds of simple indicators have been highlighted on the map:
- The measuring of the cluster’s openness through 4 indicators detailed hereafter in the part entitled “measuring of the degree of openness of the clusters”.
- A description of the methods of collaboration between the cluster and its national and international equivalents.
- The four largest institutions that publish in clusters with the top list of each type (Universities, Firms / companies, governmental laboratories, and others / hospitals)
- The amount of addresses (whole counts) applying to those criteria : the applicant is a person, the applicant is geographically outside of the cluster but in the same country than the inventors, the applicant is geographically outside of the cluster and in another country than the inventors
- The size of the lines between clusters shows the intensity of the relationship.
- The size of the cluster (black or red dot) is proportional to the amount of addresses (fractional counts) referring to the cluster.
Measuring the cluster’s openness:
Four indicators (Openness, International openness, Relative openness, Relative international openness) have been implemented to better understand the connections between applications from inventors having collaborated inside the cluster and those implying collaborations with other clusters. These indicators show the capacity of a cluster to attract technological collaborations, national or international, from outside its own territory.
These indicators enable us to answer 2 questions:
- Applications related to the clusters: are there more applications concerning inventors present in the cluster or outside the cluster?
- When the inventors of a patent belonging to a cluster collaborate with inventors who do not belong to the cluster, are these collaborations rather national (inside the country which the cluster belongs to) or international?
To answer those two questions, four indicators of two different kinds have been implemented:
- Absolute values corresponding to raw data, i.e. the sums of the fractional counts of the addresses (Openness et International openness)
- Relative Values corresponding to absolute values normalized with respect to world averages using the same indicators (Relative openness and Relative international openness). Hence, a value of 1 equals the world average, a value inferior to 1 indicates that the cluster has a smaller degree of openness than the world average and a value superior to 1 indicates that the cluster has a bigger degree of openness than the world average.
Here are the formulas applied to the 4 indicators:
- Openness: sum of the addresses involved concerning collaborations outside of the cluster, divided by the sum of the addresses of the patents belonging to the cluster inside which the inventors collaborate.
- International openness: sum of the addresses involved concerning international collaborations (except collaborations between the cluster and the national territory, ie the country the cluster belongs to), divided by the sum of the addresses of the patents where the inventors collaborate with the national territory (country) of the cluster (except the addresses of collaborations belonging to the cluster).
- Relative openness: Openness of cluster divided by world average of clusters’ openness. A value superior to 1 indicates that the cluster has a greater tendency than the world average to look for collaborations outside its territory.
- Relative international openness: International openness divided by the world average of International openness of clusters. A value superior to 1 indicates that the cluster has a greater tendency than the world average to look for collaborations outside its territory (country the cluster belongs to).
Comparing values of relative openness to relative international openness gives information on the importance of national collaborations in a territory. Hence, a cluster can be largely open to national collaborations but much less so to international collaborations.
Text by Sciences, technologies and visualizations, translation by Hélène Hirsinger