")
")
Scientific collaborations in the field of nanotechnologies
 |
|  |
| 
Based on our different research, this article displays an interactive map of scientific collaborations between geographical clusters where scientific publications in the field of nanotechnologies were published between 1998 and 2006.
General context: elements of methodology
Based on a delineation in the field of nanotechnologies (« Data search strategy for science and technology emergence: A scalable and evolutionary query for nanotechnology tracking » published in 2007 in Research Policy by Andrei Mogoutov, Bernard Kahane) making it possible to identify patents and publications through a lexical query, we have made up a database with more than 500 000 scientific publications published between 1998 and 2006. We have tagged each publication with one or several addresses depending on the number of authors having participated in the writing. After having geolocalized those 1 200 000 addresses, we have identified geographical areas that form groups of towns with a high concentration of scientific activity in the field of nanotechnologies. These groups of towns are called clusters.
Full screen mode
Precisions concerning the depicted scientific collaboration networks:
Once the publications were located on the globe, we identified the agents working in the field: institutions, companies and firms, governmental laboratories and hospitals. Some of the results of our research are presented here on the interactive map showing the different scientific collaboration networks of the main clusters involved in the development of nanotechnologies in the world.
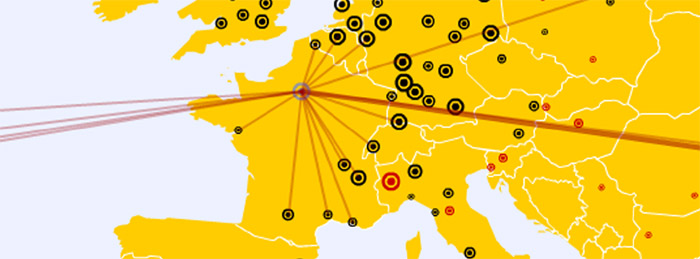
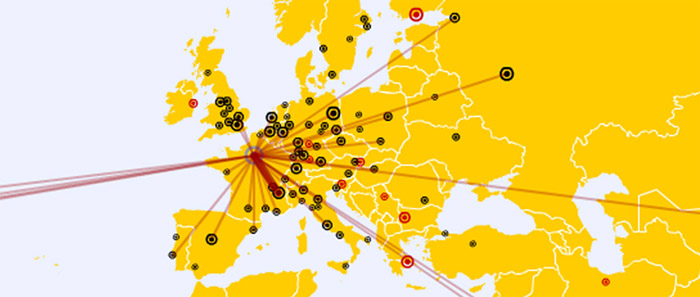
2 different dots are used on the map:
- Black dots: clusters that are integrated connections in the global networks of nanotechnology development.
- Red dots: clusters that are not integrated into those networks but have a significant scientific production in the field of nanotechnologies
The threshold that has been used here to measure the level of integration of clusters in the networks consists in 75 shared addresses (during 8 years; this threshold differentiates black dots from red dots on the map).
Shared addresses are the results of publications of which at least one of the author's addresses belongs to the cluster and at least one belongs to another cluster. In that case, a publication with shared addresses enables clusters to connect.
The different indicators displayed on the map:
Different kinds of simple indicators have been highlighted on the map:
- The measuring of the cluster’s openness through 4 indicators detailed hereafter in the part entitled “measuring of the degree of openness of the clusters”.
- A brief description of the integration of clusters: number of shared addresses with Asia, Europe, North America (USA and Canada) and other countries.
- The four largest institutions that publish in clusters with the top list of each type (Universities, Firms / companies, governmental laboratories, and others / hospitals)
- The institutional profile of the cluster : number of existing institutions on the territory by differentiating four types : Universities, Firms / companies, governmental laboratories, and others / hospitals
- The relative specialization of the main clusters in four large subfields characterizing nanotechnologies: nanobiotechnologies, nanoelectronics, nanophysics, nanomaterials, nanochemistry etc. This specialization is relative because the values given to the clusters are compared to the world averages in different fields (<1 the cluster is under specialized in the field > 1 the cluster specializes).
- The size of the lines between clusters shows the intensity of the relationship (the strongest relationships are superior to 500 shared addresses and correspond to 43 clusters out of 200).
- The size of the cluster (black or red dot) is proportional to the number of addresses referring to the cluster directly (amount of addresses of authors belonging to the city or geographical area).
Measuring the cluster’s openness:
Four indicators (Openness, International openness, Relative openness, Relative international openness) have been implemented to better understand the connections between articles written by authors having collaborated within the cluster and those implying collaborations with other clusters. These indicators show the capacity of a cluster to attract national or international knowledge, outside its territory through scientific collaborations.
These indicators enable us to answer 2 questions:
- Articles written within the cluster: are there more articles written by authors present in the cluster or outside the cluster?
- When the authors of scientific publications co-write with authors who do not belong to the cluster, can these collaborations be considered rather national (inside the country which the cluster belongs to) or international?
To answer those two questions, four indicators of two different kinds have been implemented:
- Absolute values corresponding to raw data, i.e. the sums of the addresses (Openness et International openness)
- Relative Values corresponding to raw values normalized with respect to world averages using the same indicators (Relative openness and Relative international openness). Hence, a value of 1 equals the world average, a value inferior to 1 indicates that the cluster has a smaller degree of openness than the world average and a value superior to 1 indicates that the cluster has a bigger degree of openness than the world average.
Here are the formulas applying to these 4 indicators:
- Openness: sum of the addresses involved concerning collaborations outside of the cluster, divided by the sum of the addresses of the patents belonging to the cluster inside which the inventors collaborate.
- International openness: sum of the addresses involved concerning international collaborations (except collaborations between the cluster and the national territory, i.e. the country the cluster belongs to), divided by the sum of the addresses of the patents where the inventors collaborate with the national territory (country) of the cluster (except the addresses of collaborations belonging to the cluster).
- Relative openness: Openness of cluster divided by world average of clusters’ openness. A value superior to 1 indicates that the cluster has a greater tendency than the world average to look for collaborations outside its territory.
- Relative international openness: International openness divided by the world average of International openness of clusters. A value superior to 1 indicates that the cluster has a greater tendency than the world average to look for collaborations outside its territory (country the cluster belongs to).
Comparing values of relative openness to relative international openness gives information on the importance of national collaborations within a territory. Hence, a cluster can be largely open to national collaborations but much less so to international ones.
Example of analysis on degrees of openness:
Comparing values of relative openness to relative international openness gives information on the importance of national collaborations within a territory. Hence, a cluster can be largely open to national collaborations but much less so to international ones.
For example and on the contrary, Paris and its outskirts represents a centre of average openness (Relative openness = 0.99) considering the number of collaborations outside the center but of greater openness considering international collaborations (Relative international openness = 1.66). The reason is that on a French scale the Parisian centre is self-sufficient as far as national scientific collaborations are concerned but looks for international collaborations when the knowledge is not to be found locally. Some clusters of a smaller size like Grenoble show a better balance (Relative openness = 1.58 and Relative international openness = 1.42), the opposite in Toulouse (Relative openness = 1.17 and Relative international openness = 1.01).
For further information :
To complete this information, you can watch the video that gives different explanations about the connections between globalization and scientific production in nanotechnologies. A focus is made on some of the information depicted on the map:
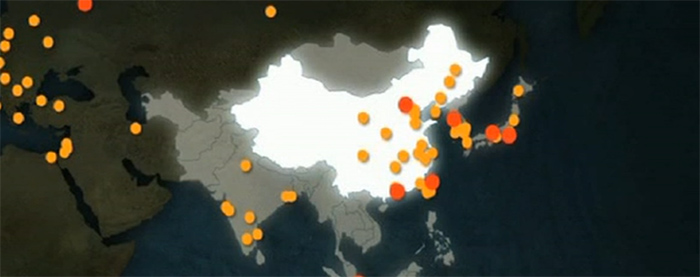
- Concentration of production and its unequal distribution
- different profiles between Europe, Asia and the US
- collaborations inside the EU
Text by Sciences, technologies and visualizations, translation by Hélène Hirsinger