Global map of technology
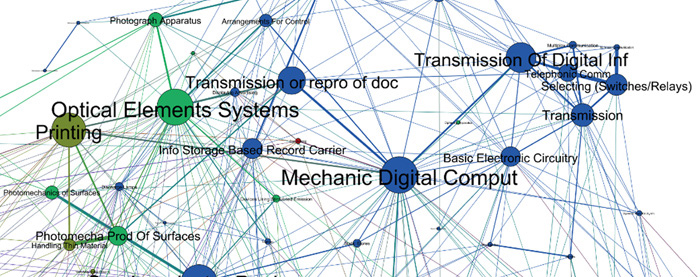
This research presents first a document level global map of technology that characterises the proximity and dependency of technological areas. In a second place, the technological portfolios of two large industrial corporations (IBM and BASF) are projected on this global map of technology, allowing comparisons that are visually attractive, very readable, and potentially useful for research, development and innovation policy makers as for research managers within corporations.
The same tool can be used for mapping any actor’s technological profile, be it universities, public research organisations, regions, countries... An original classification identifying 389 technological subfields provides a finely grained visualisation.
A useful tool for analysing corporations’ inventive profiles by : Antoine Schoen, Jean-Philippe Cointet, Lionel Villard, Patricia Laurens, Ismael Rafols
Methodology
The distance between areas of technology is based on the analysis of co-occurrence of IPC-codes assigned to individual patent documents. The more often a code is assigned to patent documents within one area together with codes of another area, the stronger is the relationship between those codes or the shorter is the distance between the technological areas standing behind the codes.
Classification
This map uses an original classification of technology that distributes all inventions in 389 non-overlapping classes.
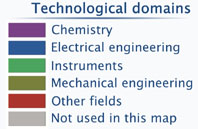
This IFRIS classification is based on the well-established WIPO hierarchical classification that distinguishes, at its finest aggregation level, 35 technological fields, these 35 fields, being grouped in 5 technological domains.
The IFRIS classification adds a finer grained level of disaggregation - i.e. below the level of technological field - of 389 technological subfields.
| Technological Domains | Number of prioritiy Patents | Associated with other technologies |
|---|---|---|
| Source : Corporate Invention Board, Priority Patents 1986-2006 | ||
| Chemistry | 15,2 % | 21,1 % |
| Electrical engineering | 40,7 % | 36,5 % |
| Instruments | 15,7 % | 17,4 % |
| Mechanical engineering | 23,2 % | 20,8 % |
| Other fields | 4,1 % | 3,3 % |
Data
This research uses the Corporate Invention Board dataset. The sample of patents analysed for drawing the global map of technology encompasses all priority patents (over 6 millions documents) applied for all over the world between 1986 and 2005 by the 2400 largest private R&D performers – i.e. the corporations monitored in the EU Industrial R&D Investment Scoreboard.
[ Explore the map in fullscreen mode ]

IBM patent portfolio
IBM has applied for 47 998 prioritiy patents worldwide between 1986 and 2005. This portfolio of priority patents has been projected as an overlay against the background of the global map of technology.
| Technological domains | Number of prioritiy patents | Associated with other technologies |
|---|---|---|
| Source : Corporate Invention Board, Priority Patents 1986-2006 | ||
| Chemistry | 1.8 % | 5.9 % |
| Electrical engineering | 85.9 % | 73.2 % |
| Instruments | 8.0 % | 13.1 % |
| Mechanical engineering | 2.3 % | 5.4 % |
| Other fields | 0.2 % | 0.7 % |
BASF patent portfolio
BASF has applied for 19 170 prioritiy patents worldwide between 1986 and 2005. This portfolio of priority patents has been projected as an overlay against the background of the global map of technology.
| Technological domains | Number of prioritiy patents | Associated with other technologies |
|---|---|---|
| Source : Corporate Invention Board, Priority Patents 1986-2006 | ||
| Chemistry | 81.4 % | 82.0 % |
| Electrical engineering | 2.0 % | 1.8 % |
| Instruments | 2.9 % | 3.1 % |
| Mechanical engineering | 10.7 % | 10.5 % |
| Other fields | 0.5 % | 0.8 % |


